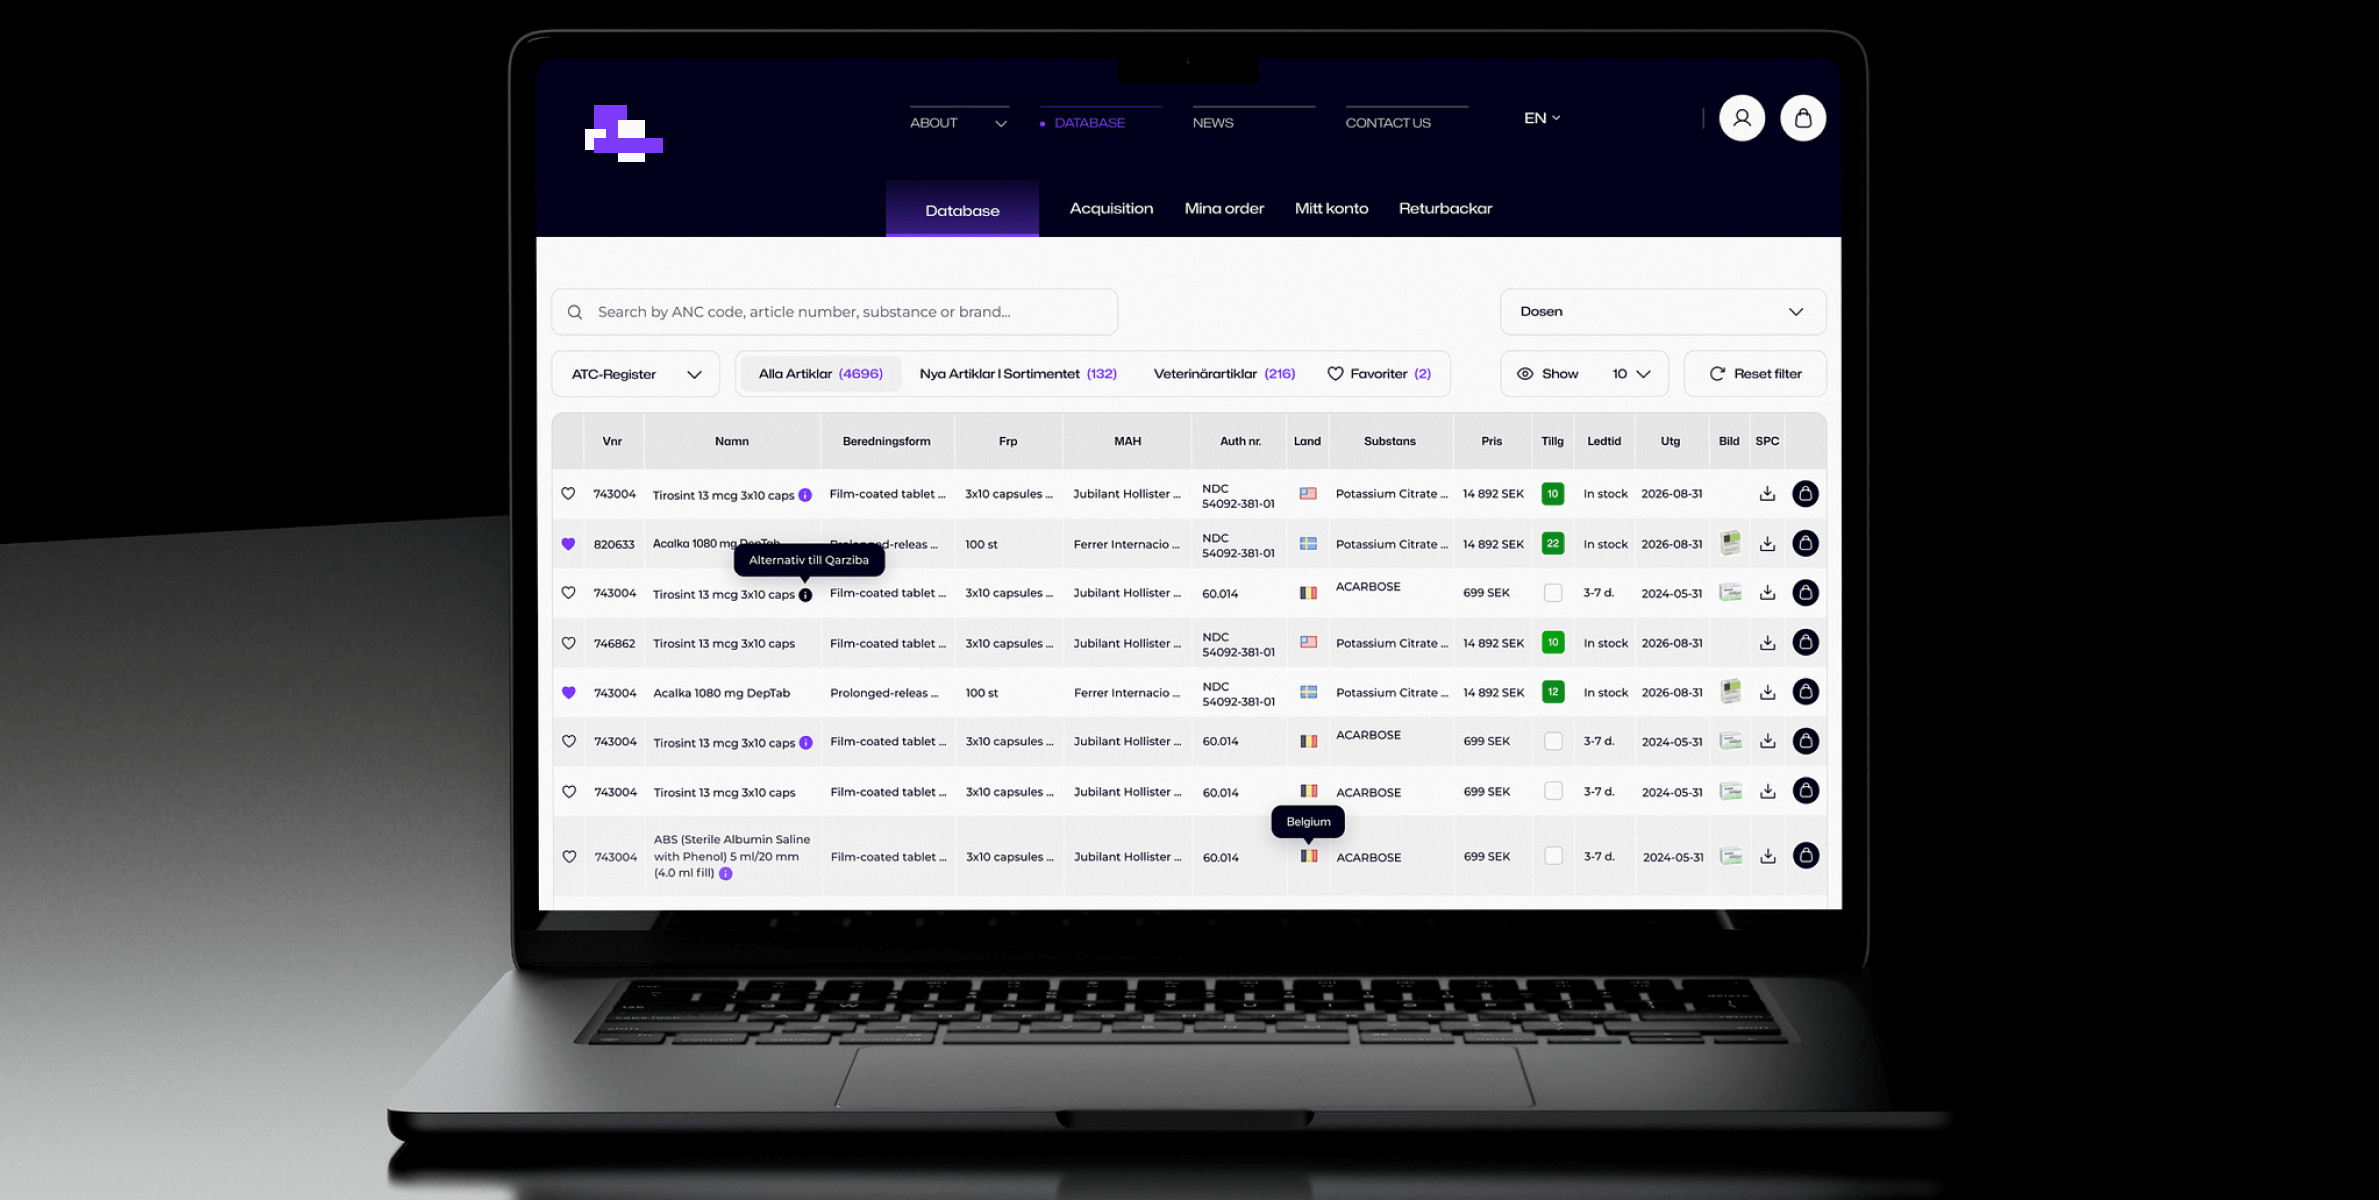
Designing Big Data Tables: Insights from a UX/UI Perspective

When you’re putting together data tables for big datasets, it’s important to think carefully about how you design them so you get the best of both worlds: clarity and performance. It’s all about having a logical structure to keep things clear and organized. Make sure the essential columns are front and center, and keep the less frequently used information hidden or accessible via expand/collapse features. Including frozen headers, simple pagination, and sorting options makes it easy for users to quickly view and find key data across large datasets.
To make it easier for users to get around and interact with the data, add bulk actions and inline editing. This lets users edit, delete, or export multiple records at once. Filters and search bars also make it easier to find the data you need, so you can focus on what’s important for your task. Some visual cues, like bold headers and alternating row colors, help users quickly scan and process complex tables without losing context.
Last but not least, it’s necessary to optimize tables for mobile, especially for CRM users accessing data on different devices. Mobile-friendly layouts that adapt columns to fit smaller screens and responsive controls like dropdowns or swipe actions make sure users can still get the same powerful functionality on any device. Using a more advanced library like AG-Grid can help your site perform better while keeping it easy to use and looking great on any screen, even when you’re working with lots of data.
If you want to learn the best ways to design large data tables, including tips for making them mobile-friendly and advanced data handling techniques, check out our full article on Medium.

 OutSoft


